Americans signed the most contracts to buy homes in July than at any other point in the last two years, further evidence of a housing recovery.
The National Association of Realtors said Wednesday that its index of sales agreements for previously occupied homes jumped 2.4 percent in July to 101.7. That's higher than June's reading of 99.3. It's also the highest reading since April 2010, the last month that buyers could qualify for a federal home-buying tax credit.
A reading of 100 is considered healthy. The index is 12.4 percent higher than July 2011. It bottomed at 75.88 in June 2010 after the tax credit expired.
Contract signings typically indicate where the housing market is headed. There's generally a one- to two-month lag between a signed contract and a completed deal.
The Realtors' group said contract signings increased in July in all regions of the U.S. except for the West, which it said has a severe shortage of available homes for sale.
The increase is the latest sign that the home sales are finally rebounding five years after the housing bubble burst.
Last week, the National Association of Realtors said completed sales of previously occupied homes jumped 10 percent in July compared with the same month last year. Sales of newly built homes were up 25 percent in that same 12-month period.
Builder confidence rose this month to its highest level in five years. And the average rate on a 30-year fixed mortgage has been below 4 percent all year.
Home prices have also started to rise consistently, which could boost sales further in the months to come. The Standard & Poor's/Case Shiller index released Tuesday showed the first year-over-year increase in home prices since September 2010.
Still, the housing market has a long way to go to reach a full recovery. Some economists forecast that sales of previously occupied homes will rise 8 percent this year to about 4.6 million. That's still well below the 5.5 million annual sales pace that is considered healthy.
One trend holding back sales is that inventories of homes are low.
Overall, there were 2.4 million homes for sale in July, down 24 percent in the past year. It would take about 6.4 months to exhaust that supply at the current sales pace. That's just above the six months' inventory that typically exists in a healthy economy.
Thursday, August 30, 2012
Isaac brings higher gas prices, south and north
Drivers are being hit with the biggest one-day jump in gasoline prices in 18 months just as the last heavy driving weekend of the summer approaches.
As Hurricane Isaac swamps the nation's oil and gas hub along the Gulf Coast, it's delivering sharply higher pump prices to storm-battered residents of Louisiana and Mississippi — and also to unsuspecting drivers up north in Illinois, Indiana and Ohio.
The national average price of a gallon of gas jumped almost five cents Wednesday to $3.80, the highest ever for this date. Prices are expected to continue to climb through Labor Day weekend, the end of the summer driving season.
"The national average will keep ticking higher, and it's going to be noticeable," says Patrick DeHaan, senior petroleum analyst at Gasbuddy.com
The wide storm shut down several refineries along the Gulf Coast and others are operating at reduced rates. In all, about 1.3 million barrels per day of refining capacity is affected. So, it's no surprise that drivers in Louisiana, Alabama, Mississippi and Florida saw gas prices rise by a dime or more in the past week.
But some states in the Midwest are suffering even more dramatic spikes. Ohio prices jumped 14 cents, Indiana prices soared 13 cents and Illinois prices jumped 10 cents on Wednesday alone according to the Oil Price Information Service. Days before Isaac is expected to douse those states with rain, the storm forced the shutdown of a pipeline that serves a number of Midwest refineries.
Drivers in the region were angry and confused. ""I saw gas in my neighborhood for $3.56 a gallon just Tuesday morning, and now I'm paying $3.95. It's terrible," said Mary Allen of Cincinnati as she paid $20 for just over five gallons of gas. She wondered how Isaac could drive up gas prices in Ohio — and then resigned herself to a holiday weekend without travel.
The price surge is happening at the wrong time and the wrong place for Dickson Stewart, a 56-year-old electronics consultant, who is driving from Minneapolis to Savannah, Ga. this week. He stopped at a BP station in downtown Chicago Tuesday — home to some of the highest retail prices in the country — and paid $4.49 a gallon to fill up his Jeep Wrangler.
Stewart expects gas prices to fall after Labor Day. Analysts say he's probably right.
As Isaac fades away, the summer driving season ends, and refiners switch to cheaper winter blends of gasoline, stations owners should start dropping prices. "There is some very good relief in sight," DeHaan says.
When Katrina hit in 2005, the national average for gas spiked 40 cents in six days and topped $3 per gallon for the first time. Isaac likely won't have the same result, though its full impact on the refineries is yet to be determined.
The refineries are not expected to suffer long term damage. But refiners decided to shut down or run at reduced rates to protect their operations.
These facilities consume enormous amounts of electric power and generate steam to cook crude oil into gasoline, diesel, jet fuel and heating oil. If a refinery loses power suddenly, operators can't properly clear the partially cooked oil out of pipes, and re-starting the refinery can take several days or even weeks.
In advance of Isaac, refineries instead conducted what is known as an orderly shutdown, so they can re-start as soon as the power supply is assured again. The Gulf refineries will likely stay off line for about three days.
Isaac cut into the amount of gasoline being produced, and raised fears that supplies could fall dangerously low if the storm proved worse than expected. When supplies drop or are threatened, wholesale prices rise. Then distributors and station owners have to pay more to fill up their station's tanks. They then raise their prices based on how much they paid for their current inventory, how much they think they will have to pay for their next shipment, and, how much their competitors are charging.
Prices spiked particularly high in the Midwest because Isaac forced Shell to close a pipeline that delivers crude from St. James, La. to refineries in the region.
Gasoline prices are particularly vulnerable to spikes around this time of year. Refiners keep a low supply of more expensive blends as driving season ends, knowing they'll soon be able to make cheaper winter blends of gasoline.
"We are really working with a just-in-time delivery system," said Tom Kloza, chief oil analyst at the Oil Price Information Service.
Pump prices were on the rise even before Isaac blew in. The average price for gas rose about 40 cents from July 1 to mid-August because of higher oil prices and refinery problems in the Midwest and West Coast. At $3.80 per gallon, the national average is the highest since May 1 and well above the previous record for Aug. 29, $3.67 in 2008.
Wednesday's jump of a nickel was the 10th biggest one-day jump on record, according to OPIS, and the biggest since the average price rose 6 cents on February 15, 2011 when turmoil in Libya was rising.
But prices could quickly come down if refineries can soon get up and running. Crude oil prices fell Wednesday and wholesale gasoline prices fell the past two days, suggesting the spike in retail gasoline prices could be short-lived. Americans will soon do less driving and the switch to cheaper blends will be well underway by mid-September.
Wednesday, August 29, 2012
Is a Double-Dip in the Global Economy Possible?

China’s export growth shows major slowdown as some reports indicate a 9.2 percent drop from one year prior. Retail sales rose 13.1 percent but also fell short of analyst’s predictions. In a recent briefing, Gao Hucheng, China Vice Commerce Minister stated that China continues to maintain confidence that they will reach their projected growth target of 10% for the year. Money, European Union Sales, and Retail Suppliers have all seen downslides in growth from prior year figures for China. Numerous large global economies are facing declines and stagnation in growth forecasts. The bottom line is that the figures represent signs that the global economy is weakening.
China is ‘Missing the Mark’ for Numerous Forecasts
China represents the world’s second largest economy is experiencing the worst export growth since 2009. Additionally, a visible dip in new yuan lending in July showed the lowest monthly figures since September 2011. M2 which is the broadest measure of the money supply came in at 13.9 percent last month against a predicted 13.8 percent gain. Local currency lending in China was significantly lower at 540.1 billion yuan than Bloomberg News Survey’s predicted at 919.8 billion. Li-Gang, Hong Kong based leader of the Greater China Economics at Australia & New Zealand Banking Group, Ltd. says that “there’s a risk of a ‘hard landing’ and the government may lower banks reserves requirements as soon as today.”
The main concern is the decline in exports although Vice Commerce Minister Gao Hucheng voices confidence that China will still achieve the 10 percent goal for trade expansion this year. This is in the face of Chinese sales to European Union countries falling 16.2 percent for the previous month. The Central Bank of China stopped gains in the yuan during the first half of 2012 which gave some reprieve to exporters that are facing a deteriorating global demand. Li & Fung Ltd., the world’s largest retail clothing and toy supplier dropped drastically. Li & Fung Ltd. supply goods to retailers such as Target and Walmart and the economical downslide in the United States contributed to the slump experienced by exporters in the first half of the year.
Additional Global Effects of Euro Debt Crisis are Visible
Nearby Singapore also experienced a shrinking in its economy by 0.7 percent in the last quarter, less than the projected 1.1 percent. In France, the second largest European economy is weathering industrial stagnation as of June which lends to the possibility that France is heading toward their first recession in three years. Elsewhere, the Russian Central Bank opted out of raising loan rates for an eight month in row, trepidation over inflation risks due to higher interbank rates and weak harvests which can both lead to a constraint in lending growth. In Canada, the unemployment rate held steady at 7.2 percent in July while the Brazilian unemployment rate dropped to 5.7 percent for a third month in June. Germany underwent an unexpected slowdown in inflation from 2 percent in June to 1.9 percent in July. Overall China is facing export deceleration at a slowdown rate of up to 7.4 percent for the quarter. Much uncertainty remains and is centered on the risk presented by the European debt crisis and the negative effects that it may have on global economies.
Is Italy Sinking into the Economic Mire?

In a year’s time, Italy’s economy dipped twice as much as predicted by the Italian government of techocrats. The financial hit spread itself around to include agriculture, industry and services. Italy was down close to 0.8 percent in the GDP after the first quarter in 2012. It was the country’s fourth drop in a row. A survey of analysts came close, saying Italy would fall 0.6 percent, but it was worse than even they expected. The country hasn’t seen a fall like that since 2009.
While the drop is startling, it should be noted Italy’s economy has dragged for more than 10 years. Financial investors are worried. Prime Minister Mario Monti is having a difficult time of it, trying to cut the deficit 0.1 percent of the GDP by 2014. Italy needs public financing from Monti’s European partners. It’s benchmark bond yields are still sitting at nearly 6 percent, and acquired growth was negative. And, if in the next two quarters, the GDP reads flat, it will down a total of 1.9 percent since last year.
Austerity Measures for Italy
Monti claims he will step down next spring as the new election begins. At the end of 2011, he made more than 20 billion euros in cuts to stave off a debt crisis, but the package was flawed because of its compounding tax hikes. The cuts only pushed Italy further into the recession, and dampened the spirits of consumers. Consequently, 2012 will see an influential dive in spending per capita, the first of its size since post war, the retail confederation projected. Italy’s economy is very inefficient, some say. It has failed in the areas of infrastructure development, research investment and market reforms. Italy also has an above average deficit. Last year, the country’s ranking was 87th in the world.
Factors surrounding the debt crisis include the financial forecasts that based everything on debt issue costs. In the second quarter, Italy experienced earthquakes in Emilia. Italians aren’t saving anymore. They don’t have the money to save or invest, and earlier this summer, Italy paid its highest interest rates so far this year. Taking all that Italy has lost and most likely continue to lose, its double-dipped in recession. Unemployment is heading toward 10.4 percent for 2012, and 11.8 in 2013, but hitting a peak of 12.4 percent in the fourth quarter of 2013.
Gold Reserves in Italy
The business lobby, Confindustria, criticized the labor reforms that were recently approved by parliament. The lobby stated the reform was “inferior to expectations and the needs (of the market), and risks increasing complications.” There is no available data from the effects of the reform, but it is far removed from Italy’s impressive holdings. Italy is home to the world’s third largest gold reserve; an innovative business community; and industrious agricultural wine communities. Italy is the world’s largest producer in wine. The country is also savvy in the automobile industry, appliances and fashion. Post war was a turning point because industry abruptly replaced agriculture. The country itself was devastated in post war.
Italy continues to lead in world trade and exports. It continues to live by very high standards, perhaps deceiving the perception that it is enjoying the world’s eighth highest quality of life. The southern part of the country is underdeveloped and poor. Further issues holding the country up from advancing are political corruption, organized crime and unemployment.
Today's oil price

$95.02 per barrel
Daily change of 1.31 ( 1.36% )
Oil Quote Updated Aug-29-12 11:30 AM
Tuesday, August 28, 2012
The Benefits of US Bailouts
Three to four years ago, the United States Government took the bailout avenue for major companies like GM Motors, and financial institutions. There are several reasons why the government chose to provide assistance to the banks and corporations that were desperately in need of funds. The government also designed and implemented other programs within the bailout to make it even more effective.
The Economy
Any government’s purpose is to provide for the whole of its population, not just the few. If it makes sense to provide funds because a corporation is in need of a loan, the government takes into account the impact the corporation’s closing will have on the employees, and other factors. In this instance, the U.S. was not only concerned about the employees. The neediest banks that used the bailout, and received approximately $45 billion in aid, were Bank of America and Citigroup. It may seem like a lot of money, but didn’t come close to American International Group, which required $182 billion. This, coupled with overseas banks failing as well, could have collapsed the economy, causing massive devastation.
Employment
An falling corporation generally shaves off the number of its employees to save money or it finds another way to downsize, such as closing store outlets. For example, GM identified more than 2,000 locally-run dealerships to close. The corporation not only stuck the small dealerships with hundreds of specialty tools they could no longer use, it contracted to independent sign construction dealers, who were directed to visit each location and physically destroy GM’s signs. But, GM also has a couple of hundred thousand employees, and is known as the world’s largest automaker. In effect, it was a wise decision to save GM as a whole, instead of just the small dealerships.
Legislative Action
Back in 1989, President George W. Bush signed the Financial Institutions Reform Recovery and Enforcement Act after the savings and loan industry was awarded a bailout. The government fine tuned the regulations in the hopes the Act would prevent further collapses. It abolished the Federal Home Loan Bank Board and Federal Savings and Loan Insurance Corporation. The government created several bodies to perform specific functions. The Office of Thrift Supervision, Federal Housing Finance Board and the Resolution Trust Corporation, and gave more responsibility to Freddie Mac and Fannie Mae to provide mortgage support to families that made low to moderate incomes.
In addition, the TARP, the Troubled Asset Relief Program, was a move the government made in the face of the sub-prime mortgage crisis. The program was endorsed into law in 2008 at a higher ticket than the Congressional Budget Office estimated earlier this year, which was $431 billion. The program allows for $700 billion for mortgages, securities and additional financial issues that could affect market stability. The assets have to be “troubled” to receive the assistance of TARP, and banks are not allowed to use the program to recoup losses.
Investment Return
The government makes loans with interest in bailouts through TARP. The U.S. and foreign banks were bailed out for a total of $245 billion. Dividends, interest and other income have amounted to approximately $13.7 billion in the $169 billion that has been paid back. Another $4 billion came back for warrant proceeds. A recoupment provision in TARP focuses on the repayment to taxpayers. Once TARP reaches its 5-year anniversary, the Office of Management and Budget must submit a financial report on TARP to Congress. The provision prevents TARP from increasing the national debt.
The impact of supply and demand on the exchange rate
The exchange rates of currencies are affected by many factors like inflation, economic stability, interest rates, government intervention and monetary policies. These factors influence the supply and demand for a particular currency and the exchange rate is affected as a result. Generally, a currency that is in high demand has a more valuable x-rate with foreign currencies. On the other hand, a currency that has a large supply will not have a great of an exchange rate with other currencies.
Trading Currencies
The forex market can be a complex arena. Forex trading involves the relationship between one currency to another and this is why currency quotes are given in pairs. The currency market frequently uses the U.S. dollars to quote currency pairs because it is accepted worldwide. For example, a quote for the currency pair EUR/USD is 1.3428 meaning that 1 euro costs 1.3428 dollars. Other examples of currency pairs are GBP/USD (British pound and U.S. dollar) and USD/JPY (U.S. dollar and Japanese yen).
Supply & Demand
The fundamental law of supply and demand is relevant in the currency market just as it is to services and good. Currencies that are in high demand have a higher value than currencies that are in low demand. In addition, a large currency supply will reduce its price. The forces of demand and supply are complex and are influenced by many players including consumers, governments, corporations and foreign investors. As an example, the increase in the U.S. dollar may be due to a greater demand by foreign investors who purchase U.S. financial instruments like bonds and stocks.
Intervention by the Government
Government intervention can directly impact the demand and supply of a currency, thus affecting the price of the currency in the markets. Governments may choose to intervene in order to protect their interests. For example, the Japanese government decided to exchange 4.5 trillion yen for U.S. dollars in 2011 in order to keep the price of the yen low. In this case, the Japanese government wanted to stop the price of the yen from increasing in order to keep its exports prices low. On the other hand, the purchase of U.S. dollars by the Japanese government reduced the supply of the dollar and increased its value.
Economic Factors
There are several economic factors that affect the demand and supply for currencies. For example, a country with higher interest rates draws more foreign investors who are seeking greater returns. This results in the increase of demand for that currency. Other economic factors that affect demand and supply include inflation and the political and economic environment. Generally, the less stable the economy of a particular country is, the lower the demand for the currency is. In this instance, it is usually more expensive to purchase the currency because of the low supply as the transaction costs to purchase the currency are higher.
Ask and Bid Quote
One way to determine the demand and supply for a particular currency is to look at the spread between the ask and the bid price. Generally, a currency that is in high demand will have a smaller spread between the ask and big price than currencies with low demand. As an example, the spread for USD/JPY and EUR/USD is fairly small and is measured in fractions of a percent – these currencies have a high liquidity. This allows currency traders to easily get into and out of trades. On the other hand, currencies that have low liquidity usually have a low demand and high supply. These currencies will have larger spreads between the ask and bid prices.
Protect Yourself from Financial Mishaps
Financial mistakes can be devastating, but luckily, most of these mistakes can be avoided. When you are informed about these common financial pitfalls, you will be able to avert them by making a more educated decision. Finances can be complicated and stressful, but when you have knowledge on your side you can navigate through these situations with confidence. Here are some of the most common financial mistakes and what you can do to avoid them.
Refinancing Your Home to Pay Your Debts
Using the equity in your home to pay off your credit card debts, for example, may be effective but the risk is too great. If you lose your job and you have refinanced your home, you may be unable to pay your large monthly mortgage payments and this could lead you into foreclosure. Instead of refinancing your home, you should use alternative methods to get money to pay your debts. You can do this by taking a second job, taking out a loan with a lower interest rate than your credit cards or pay off the credit card with the highest interest rate first. Remember, paying off your debts is not a quick process; it takes hard work and dedication. Fortunately, it is possible if you focus on alternatives to refinancing your home.
Buying a Home That is Too Expensive to Fix
You can make a considerable amount of money by purchasing a home and renovating it. However, there are some homes that are simply beyond repair. If you want to purchase and remodel a home, you should get a home inspection first. The inspector will give you insight to any of the visible problems the home may have and if they are significant or minor issues. Once you have received the inspector’s report, you can then calculate how much it will cost to make all the necessary repairs. After you have done this, you can choose to get out of the deal or ask for a price reduction.
Defaulting on Student Loans
When you default on student loans, it puts you in a very difficult position. First, you may not be able to take out any other loan because of the damage the default has done to your credit score. Also, you will not be able to get another loan from the government until you have resolved your unpaid student loans. In addition, the government can garnish your wages if you have defaulted on a student loan.
The government can take a maximum of 15% of your wages until all payments and penalties associated with your loan are resolved. If you are facing a default situation, there are some steps you can take to help yourself out of it. You should speak to your lender about options that will make it easier for you to make regular payments. There are also many private companies that will work with the government on your behalf to lower your monthly payments.
Plan for Your Retirement: Do Not Rely on Social Security or Your Home
There are many people who believe that their home can help supplement their Social Security benefits if necessary. You may think that you can always put your home on the market if you need to, but this is not always true. Houses can remain on the market for months or even years, particularly if there are maintenance issues. If you depend on your home to bring in money to pay for potentials costs relating to family or medical bills, you may face a big problem. Also, you should not rely on your Social Security for potential bills either. Now, the children of the baby boom are reaching the age of retirement and Social Security is becoming more difficult to maintain.
At any time, the government may decide to get rid of Social Security or there may not even be enough money that is put into it to pay for your expenses. Even though you have paid into Social Security your entire working life, you may not be able to get that money back if you need it. In order to avoid becoming victim to this during your golden years, you should start planning for your retirement now. It is important to start saving money for retirement as soon as you can so you will be prepared for large medical bills or any other financial burdens.
Common-Sense Methods to Forecasting Stock Market Prices
If someone were able to predict stock market prices with complete accuracy, this person would make an absolute fortune along with any person who uses those prediction methods. Unfortunately, no such person or method exists. The stock market is difficult to understand and is influenced by thousands of factors that cause prices to fluctuate and become volatile. There are many software programs that analyze these variables to help predict prices, but there are also some simple, common-sense methods that can be used to make an educated estimate of the stock prices in terms of your investment.
Analyzing Micro-Economic Indicators
Essentially, microeconomics is the actual performance and structure of sectors or firms in the economy. This means that you will begin developing your forecasting method by choosing the stocks that you want to purchase and forecast. You will start your analysis by using information that is provided by the firm to investors along with market research reports that are available from brokerage firms or banks.
Compiling Micro-Economic Indicators
The next step in your analysis is to compile the simple microeconomic indicators that are important for your stock. You should keep an eye out for changes in management or any other signs of long-term instability. You should also track the movement of corporate profits and follow future investment plans. Most importantly, you should research the firm thoroughly to find information on investment plans and products as well as new initiatives. These factors will give you the information you need to forecast changes in future stock prices. Generally, firms with stable and consistent management as well as new initiatives and products will cause an improvement in the performance of the firm and an increase in stock prices.
Ratio of Price and Earnings
Next, you need to calculate the price/earnings ratio. This ratio is the amount of money that investors will pay per share in terms of the amount of earnings for each share. Normally, most investors will pay between $10 and $15 for $1 in earnings for each share per year. If this ratio is greater than 15, there is probably reason to believe that the stock is overpriced and is heading for a fall. Reported earnings are generally mailed to investors in the quarterly figures reports.
Macro-Economic Indicators
You should also put macroeconomic indicators into your model. Microeconomic analysis can increase the effectiveness of your model but it is still not enough. Firms that have great management can also suffer from factors that are outside of their control. The most important macroeconomic indicators that you should take into account are rate hikes, tax increases, fuel cost increases and poor media coverage – this is not exactly an economic factor but it can create economic consequences.
Create Your Model
Finally, you can create a model to help forecast stock prices by using the information you gathered about microeconomic and macroeconomic indicators. In markets with more stability, like Western Europe and North America, the microeconomic factors will influence stock prices the most. However, factors like tax increases can significantly change the profits of a firm and must be considered in your model. Although there is no model that is perfect, this simple model can give you a reasonable idea of the direction of future stock prices.
Stockpiles of Oil and Fuel Accumulate

As China’s economy experiences a slow-down they will consume much less oil for 2012 and 2013. The U.S. government’s Energy Information Administration (EIA) expects the significant stock-piles of oil to relieve global oil markets for the second half of 2012. A consensus of three top energy market forecasters says that the output of crude oil has exceeded the demand significantly creating a ‘comfortable’ global supply of oil. This may mean a bit of relief for consumers that are growing accustomed to exorbitant fuel prices. There may still be worry over the security of the oil supply considering turbulent world affairs, particularly in the Middle East.
Oil Producers Outlook: Negative
A bit of relief at the fuel pumps, it might happen. A sense of security with the ‘comfortable’ supply of crude oil worldwide, it would be good. However it is too soon to ascertain how current world events will affect the overall outcome and the impact that it will have on consumers. For the producers of oil, the International Energy Agency’s (IEA) forecasts a balancing of impact on oil prices due to concerns over political tensions such as the opposing views and tensions between the West and Iran surrounding the Nuclear Program in Tehran. The outlook for oil producers, according to David Hufton, managing director of brokers PVM in London, is not good for companies that will not likely see a rise in share prices.
World Affairs Impact: Pessimistic
A monthly report by the IEA regarding the second half of 2012 states “The geopolitical dimension is likely to continue to provide something of a floor for prices.” The situation between the West and Iran will continue to weigh-in heavily. Overall the supply and demand fundamentals for the market are weak although the global oil production in July was 2.6 million barrels per day (bpd) higher than in July 2011. Forecasters agree that the recent progress made toward restoring output from Iraq, Nigeria, and Libya could be threatened if political and civil tensions intensify.
In June the price per barrel fell below $90 after Saudia Arabia raised production when Iranian exports decreased as a result of Western sanctions. Iranian oil exports fell in July to multi-year record lows but the IEA adds that Iranian oil sales could be sold to major consumers soon. North Sea Brent crude oil prices are now reported at $110 and the recovery is attributed to Iranian tensions and investor’s expectations that new money printing programs from global central markets will commence. The report further predicts that there is potential for Iranian imports to recover moderately beginning in September. The decelerated growth rate and slowed economy will still have an impact as 1 million bpd of Iranian oil may have difficulty finding buyers during the second half of 2012.
How do you think the global stockpiles of oil will affect the world economic markets? Do you foresee any sudden surges in global demand? Please share your thoughts with us.
An Explanation of Exchange Rate Types
Essentially, an exchange rate is a measure of the value of a currency when it is traded for another currency. The most common type of exchange rate is the floating exchange rate, where the value of currencies can vary depending on the law of supply and demand. A floating exchange rate means there is no government intervention to change the value of the currency. However, countries can choose the type of exchange rate they wish to use in order to change the value of that country’s currency.
Fixed or Pegged Exchange Rate
A fixed or pegged exchange rate is an exchange rate that evaluates a currency compared to one currency, several currencies or against a particular measure of value like gold prices. This type of exchange rate is most commonly used to stabilize the value of a currency against the currency which it is compared to.
The Use of Multiple Exchange Rates
The multiple exchange rate system is exactly as it sounds – the use of multiple exchange rates to value a specific currency. Therefore, there are several exchange rates that are used in transactions with foreign countries and each transaction is completed with a different exchange rate. This type of exchange rate system is comprised of a combination of floating and pegged exchange rates. Essentially, this means that non-essential exports and imports use a floating exchange rate that is based on market forces while essential exports and imports use a pegged exchange rate.
Rigidly Fixed Exchange Rate
A rigidly fixed exchange rate is a type of fixed exchange rate that makes use of the gold standard, dollarization and currency boards and unions. When the gold standard is used, the exchange rate is based on the gold reserves in that country. Currency unions are made up of several countries that eliminate their individual currencies and opt to use a single currency – eliminating exchange rates between the currency union members. A currency board system involves the backing of every unit of currency by the same amount of reserve currency – a useful anti-inflation instrument. Dollarization simply means that one country decides to use the currency of another country. As an example, the U.S. dollar is used in Ecuador and Samoa.
Managed Exchange Rate
A managed exchange rate means that the government of a particular country has some influence on exchange rates that otherwise would be floating. This means that the exchange rate can fluctuate but the government prevents any excessive depreciation or appreciation of the currency.
What do you think about these types of exchange rates? Which exchange rate types do you think are beneficial or harmful? Please leave your comments below.
Daily Market Overview 27.08.2012
Today both U.S. and European indices rose, as investors are having expectations for further stimulus of the economy from the world’s top policymakers. Investor’s attention is focused on Friday’s meeting at Jackson Hole, Wyoming, where there are speculations that the Federal Reserve, will provide more support to the economy and that the European Central Bank (ECB) also will act soon. Euro holds its recent gains against the U.S dollar even though German business sentiment came in worse than expected in. On that note the ECB hopes that Germany will provide more to support to deal with the European debt crisis.
The DJ30 closed at 13,124.67, declining 33.3 points (-0.25%), SPX500 closed at 1,410.44, declining 0.69 points (-0.05%) and the NASDAQ closed at 2,782.55, gaining 4.5 points
(0.16%) in today’s trading.
The CAC40 closed at 3,462.83, gaining 29.62 points (0.86%), FTSE100 closed at 5,776.60, gaining 0 points (0.00%) and DAX40 closed at 7,047.45, gaining 76.38 points (1.10%).
Apple Inc. (AAPL):
On Friday 24.08.2012, Apple won an important Patent Suit against rival and partner Korean Company, Samsung. A verdict from a U.S jury found that Samsung had copied critical features of the iPhone and iPad. Apple was rewarded with $1.05 billion in damages and the stock rise to record highs on Monday’s session. Apple is now seeking bans on eight older model Samsung Smartphones, including Galaxy S2.In addition to this, on Friday the U.S. International Trade Commission (ITC) found that Apple didn’t violate Motorola’s patents. After winning the legal litigation, Apple’s stock rose. Furthermore the company announced that they would try to reduce the cost on the iPhone, making it cheaper for consumers. Both legal victories by Apple increased even more investor’s confidence in Apple’s growth and the price rose to new highs closing at $675.68.

STOCKS TO WATCH AT CLOSE ON TUESDAY
Stocks to watch on the Australian stock exchange at close on Tuesday:
ALL - ARISTOCRAT LEISURE LTD - up 19 cents at $2.76
Gaming machine supplier Aristocrat Leisure has reported a better-than-expected 40 per cent rise in first half net profit to $34.7 million.
ALS - ALESCO CORPORATION LTD - down 1.5 cents at $1.96
DLX - DULUXGROUP LTD - down one cent at $3.27
DuluxGroup has threatened to walk away from takeover talks with Alesco Corporation if the target company does not agree to resolve a dispute over the size of dividends in the deal.
BPT - BEACH ENERGY LTD - down five cents at $1.215
Oil and gas producer Beach Energy has forecast increased production in the year ahead after posting a significant rise in full year profit.
CRF - CENTRO RETAIL AUSTRALIA - up one cent at $2.10
Shopping centre owner Centro Retail Australia has posted a $223 million loss due to legal costs, lower property values and expenses relating to its recent restructure.
FLT - FLIGHT CENTRE LTD - up 10 cents at $23.70
Flight Centre's full year profit has increased by 43 per cent as it reaps the benefits of expansion around the world.
GFF - GOODMAN FIELDERS LTD - steady at 53.5 cents
GNC - GRAINCORP LTD - in trading halt, last traded at $9.85
Troubled food group Goodman Fielder has sold its oils business Integro for $170 million to a consortium made up of GrainCorp and Gardner Smith.
LLC - LEND LEASE GROUP - up nine cents at $8.20
More than 100,000 jobs and training for 500 apprentices and thousands of other workers will spin off from Sydney's Barangaroo development, Federal Skills Minister Chris Evans says.
SVW - SEVEN GROUP HOLDINGS LTD - up 45 cents at $8.05
Media and earthmoving machinery company Seven Group Holdings has more than doubled its full year profit but is cautious about China's growth and Australia's media industry.
UML - UNITY MINING LTD - up one cent at 12 cents
Tasmania's only gold mine at Henty has helped Unity Mining return to the black with a $12.9 million profit.
VAH - VIRGIN AUSTRALIA HOLDINGS LTD - steady at 48 cents
Virgin Australia has returned to profitability due to its growth in the corporate travel sector.
WES - WESFARMERS LTD - up 20 cents at $34.30
A Coles contractor is under fire for placing a job advertisement that said Indian and Asian people need not apply.
PETSEC SHARES RISE 4%, PRODUCTION ON TRACK
Petsec Energy shares posted strong gains after the oil and gas producer said it expects to meet its full year production guidance after posting a $5 million first half loss.
Shares in the US-based company, which is involved in oil and gas exploration and production in the Gulf of Mexico and Louisiana, rose four per cent to 12.5 cents on Tuesday.
Petsec Energy Ltd posted a $US5.2 million ($A5.04 million) loss in the six months to June 30, after recording a $US31 million ($A30.02 million) profit in the previous corresponding period.
Net revenue after royalties was $US3.3 million ($A3.20 million), down 55 per cent from $US7.4 million ($A7.17) million in the period.
"The company expects to meet its previous production guidance for the full year of two billion cubic feet of gas equivalent (Bcfe)," Petsec said in a statement.
Petsec Energy produced 1,006 one million cubic feet (MMcf) of gas and 5,919 barrels of oil for the six months ended June 30, 2012 from its five producing fields in the Gulf of Mexico shelf and the Louisiana Gulf Coast.
During the first half Petsec drilled a third well on the Marathon gas/condensate field, and a shale oil test well in Alberta, Canada.
The company is continuing technical evaluations of shale oil project areas in the United States.
In a separate statement Petsec said its Main Pass and Chandeleur offshore gas fields had been shut down and all offshore personnel evacuated ahead of the approaching Hurricane Isaac.
The company expects its Marathon and Main Pass 270 fields will also be shut prior to the storm's arrival.
The hurricane is expected to pass through the Gulf of Mexico shelf as a Category One Storm.
Petsec added that its Marathon gas/condensate Field had been brought into production.
The company said it did not declare a dividend for the six months ended June 30, 2012.
Today's oil price

$95.99 per barrel
Daily change of 0.52 ( 0.54% )
Oil Quote Updated Aug-28-12 10:00 AM
Market Commentary - European Market Essentials
The Asian session saw any markets that were linked as beneficiaries of easing fall away today as markets pulled back expectations to match the realities of whether the Fed would unveil easing measures. Early weakness clues given in the US session were also compounded by growing fears that China would get worse before it got better.
Markets have priced in too much optimism of late which has seen traders finally question the likelihood of Central Banks delivering on what the market had led itself to believe would happen.
Most traders would agree that the bond buying initiative by the ECB should eventually see the light of day but not without the all clear from the German Constitutional Court on the 12th September and not without either Spain or Italy signing away its sovereignty for a full bailout. That attaches an element of time-risk that needs to be accounted for.
The likelihood that the Fed would want to mess with the current improving pockets of their economy by printing money and sapping any of the optimism that they are currently experiencing is very minimal.
So we are left with a meeting that will see more of the same from both camps. This means that the recent overshoot needs to be adjusted and is why we will see a continued softness over the next session or two. However, trader psychology is a strange thing and if past ‘pivotal’ meetings are anything to go by we should see a rally on those same markets a day or two out as the fear of missing out should this meeting be ‘THE ONE’ is just too much for one to resist.
GFT Markets currently see the FTSE down 20pts to 5756; the DAX down 40pts to 7007 and the CAC down 21pts to 3441 on Yesterday’s close.
Australian stocks closed just shy of their opening highs today, with defensive stocks leading the gains following a mixed finish on global share markets.
Australian stocks closed just shy of their opening highs today, with defensive stocks leading the gains following a mixed finish on global share markets. The All Ordinaries Index (XAO) finished higher by 14.1pts or 0.3pct to 4387, after hitting an intra-day high of 4391.9pts.
London was closed for a Bank holiday overnight, meaning there was no direction for our miners today with the base metals market not trading. US stocks closed mixed, in the absence of major economic or corporate news. However shares in Apple rose by 1.9pct, hitting a record US$680.87 a share at one point, after winning a patent dispute with Samsung.
Locally, financial stocks did generally well, with the exception of the Commonwealth Bank (CBA). CBA shares fell 0.4pct to $54.41 while shares in Westpac (WBC) were up 0.8pct by close to $24.87 and the National Australia Bank (NAB) added 1pct to $25.25. The ANZ (ANZ) added 1pct to $24.94 and Macquarie Group (MQG) firmed by 1.7pct to $26.71.
Mining stocks were generally lower however with Fortescue Metals Group (FMG) falling 2.5pct to $3.90 as the iron ore price fell below US$100 per metric tonne. Rio Tinto (RIO) lost 0.7pct to $51.75 while index leader BHP Billiton (BHP) was slightly higher at $33.10.
Among the companies reporting today; Australia´s largest travel agent Flight Centre (FLT) reported a $200.1 million net profit for the 2012 financial year which was largely in line with market expectations. This was the first time in its history that profit topped $200m. All 10 of its markets (countries) were profitable for the second straight year and its shop numbers grew by 5pct to 2362. FLT said the business continues to benefit from its scale and diversity. Looking ahead, FLT said it´s creating a new category of travel agency; what it calls a blended travel network, which is a mix between being purely web-based & having a physical presence in the form of shops (eg. clients could start a booking in store and complete it at home). It expects profit to rise this year, is prepared for ongoing economic volatility, is planning on expanding its workforce by adding 1000 new sales staff and is on track to open its 2,500th shop within the next 12 months. FLT declared a 71 cent per share dividend, to be paid to eligible shareholders on 12 October 2012. Its shares are up by 47pct since the start of this calendar year. FLT today added 0.4pct to $23.70.
Meanwhile, discount carrier Virgin Australia (VAH) reported net profit for the 12 months to June 30 2012 came in at $22.8 million, a sharp turnaround from a $67.8 million loss in the prior corresponding period. Revenue grew 19.8pct to $3.9 billion. Virgin Australia chief executive John Borghetti said the
airline´s successful targeting of corporate and government
travellers, who tend to pay higher fares and make up 20pct of total revenue, was a key factor in the improved result. However, he said the uncertain economic environment meant it was not possible to offer earnings guidance for the 2012/13 financial year. The lack of guidance disappointed investors, with VAH shares ending steady at $0.48. Rival Qantas (QAN) closed higher by 0.9pct to $1.19.
Poker machine supplier Aristocrat Leisure (ALL) reported a better than expected 40pct rise in first half net profit to $34.7 million. The result for the half year ended on June 30 beat the forecast the company gave in July of a net profit of between $30 million and $33 million. ALL shares soared by 7.4pct today to $2.76. ALL will pay an interim dividend of 4c per share.
The Housing Industry Association today reported new home sales fell by 5.6pct in July. While only the first decline in four months, the decline wiped out all the gains over the period. It was also the second lowest monthly total of new homes sales in 11 years, behind the March 2012 result.
“After a few glimmers of light, the housing construction market is back in the doldrums,” said CommSec Chief Economist Craig James of the data. “Newly-erected homes aren’t selling, reducing the requirement for builders to start work on new projects. The Reserve Bank Governor has expressed surprise about the lack of home construction, but there still aren’t signs of an upturn.”
The Australian dollar ended the day’s trade weaker against the greenback, buying US103.69c. It was also worth Australian dollar ended the day’s trade weaker against the greenback, buying US103.69c. It was also worth €83.05 and £0.6569.
On the market overall, a total of 1.64 billion shares were traded, worth $3.65 billion. 439 were up, 503 were down and 350 were unchanged.
Monday, August 27, 2012
Should iron ore prices continue to fall, further project cancellations will see higher unemployment.
Based on the number of media reports this week, you'd think that the sky was falling. Although the sky isn't falling, iron ore prices are - and they're triggering a slew of possible events from a fallout in the Aussie dollar to a hole in our terms of trade.
According to a report in the AFR, steel production in China dropped 10% in the opening weeks of August. Product is gathering dust in the face of a weak construction market.
In November last year, US investment bank Goldman Sachs cut its yearly forecast for the price of iron ore by 6%, down to US$167.40 a tonne. They also forecasted an additional 16% drop in 2012, down to US$147.50 a tonne. According to Goldman, by 2012 the price of iron ore would average $US105 a tonne.
In March this year, the Australian Bureau of Resources and Energy Economics (BREE) said iron ore prices would average approximately US$140 a tonne in 2012 and by June had reduced the forecasted price to US$136.
You know where this story is going. None of the above predictions foresaw the price of iron ore dropping below US$100 a tonne, but it did. Just this week, on 23 August 2012, iron ore for immediate delivery fell for the seventh day, dropping 4.9% to US$99.60 a tonne. The chart below tracks the commodities fairly recent slide:

From London, Deutsche Bank analysts are telling speculators to go long iron ore below $US90 a tonne. They foresee panic selling pushing the price to US$90 a tonne - but bottoming soon after. Chinese inventory adjustment could explain the sudden shortfall in demand as the Chinese stockpile inventory - from raw materials to finished goods.
Deutsche Bank argues that the gradual winding down of economic growth in China has made government slow to react with policy measures, unlike the response to the rapid declines in 2008 and the equally rapid stimulus response.
In short, there has been minimal reaction by the Chinese to boost domestic demand - although there has been plenty of talk.
Lower iron ore prices affect our terms or trade - so much so that recent price declines could trigger a $10 million budget shortfall. When the budget was finalised, tax revenue estimates were based on iron ore prices at US$150 a tonne, with the possibility that prices could fall as low as US$120 a tonne. No one foresaw the commodity breaching US$100 a tonne (a level that makes China’s own domestic iron ore industry unprofitable).
Why should we care about our terms of trade? Well, according to Deutsche's economist, Adam Boyton, our terms of trade (or the difference between what the country is paid for exports and what it pays for imports) could decline by 15% through 2012. The warning bells are ringing - if the Government doesn't act fast, Australia could find itself mired in recession. Deutsche believes that the government is overly complacent due to the A$500 billion in resource investment projects already in place.
But resource projects are getting wound back. This week BHP announced that it was scrapping its $A28.73 billion Olympic Dam open pit expansion due to lower commodity prices and higher capital costs. As many as 140 staff will lose their jobs.
Should iron ore prices continue to fall, further project cancellations will see higher unemployment. Early this week the Australian Securities and Investment Commission (ASIC) reported business insolvencies reached record levels through 30 June 2012, with the highest filings in mining states.
In the midst of all this, our third largest iron ore producer Fortescue Metals (FMG) stepped up and delivered a solid earnings report this week, following a tough year for shareholders:

To put their year over year performance in perspective, the average realised price of iron ore over FY 2012 was US$120.2, down 12% from FY 2011’s average realised price of US$136.8.
Yet FMG beat consensus analyst estimates on both revenues and earnings. Here are some highlights from Fortescue’s full year earnings release:
Tonnes shipped (in millions) increased 42% from 39.4 tonnes in FY 2011 to 55.8 tonnes in FY2012.
Revenue was up 23% from US$5.4 billion in 2011 to US$6.7 billion in FY 2012.
Net Profit after Tax (NPAT) increased 53% from US$1.01 billion in FY 2011 to US$1.56 billion in 2012.
Net operating cash flow increased from US$2.77 on 2011 to US$2.80 in 2012.
Earnings per Share (EPS) went up 52% from US$0.329 in FY 2011 to US$0.501 in 2012.
Despite a 25% drop in iron ore prices since the end of Fortescue’s Fiscal Year and sluggish Chinese demand, the company is steaming ahead with plans to invest US$9 billion to triple its production capacity by mid 2013.
Fortescue management foresee iron ore prices rising to US$120 in the “medium term.” If iron ore prices remain stubbornly low, however, the company could be in some trouble. Currently, Fortescue is sitting on US$6 billion in debt and gearing of 226%.
Management hopes to reduce gearing to around 40% by 2014 investors; any additional funding will be accessed by a revolving credit facility.
As a pure iron ore play, Fortescue is vulnerable to further falls in the price of iron ore; interest payments on its massive debt must be met regardless of what happens to China. However, Fortescue steadfastly maintains demand will pick up in China later in the year.
What some investors forget is that China's domestic iron ore industry produces a lower grade of ore which supplies around 30% of the country’s demand. China’s domestic iron ore contains only about 20 percent iron while Australian imported ore contains more than 55% iron.
One argument is that lower iron ore prices can make imported iron ore cheaper than domestic supply. Can China's domestic iron ore industry survive when a superior grade of ore can be imported at a lower cost?
Iron ore production in China is indeed falling and there's already evidence Chinese Steel manufacturers are beginning to look to imported iron ore from Australia and Brazil. If the Chinese replace their own domestic ore with imported ore, prices could bounce.
China’s Premier Wen Jiabao is also spearheading US$23 billion of investment in new steel mills to boost production in auto-making, energy efficient appliances, and housing to jolt China’s slowing economy.
If the price remains below US$100 and declines further, the share prices of our major iron ore miners will take a thrashing; junior miners will fare even worse.
Pure iron ore plays such as Fortescue Metals and Atlas Iron (AGO) are more vulnerable than the diversified giants like Rio Tinto (RIO) and especially BHP Billiton (BHP).
While many Australians think of BHP as just a miner, the company has the most diversified resources asset base in the world. BHP is an oil and gas explorer and producer, and a miner of alumina, coal, copper, diamonds, uranium, gold, and of course iron ore. BHP shares are down almost 15% year over year. Here is a one year price chart for BHP:

Regardless of the benefits of diversification, the prices of copper, coal, and alumina have suffered alongside iron ore - limiting BHP's profits.
In addition, BHP incurred one-off write downs in its US operations. Here are some of the lowlights from the earnings release:
Revenue increased 0.7% to US$72.2 billion.
Operating profit dropped 25.3% to 23.7 billion.
NPAT fell 34% to S15.4 billion, but beat analyst estimates of US$14.6 billion.
Net Operating Cash Flow declined 18.9% to US$24.4 billion.
EPS fell 32.5% to US$0.29.
The health of the mining boom has been under the microscope for over a year and BHP’s ambitious expansion plans were often cited as evidence that all is well.
Just this week, Resources and Energy Minister Martin Ferguson joined the growing chorus declaring the end of the mining boom. His comments came after BHP announced it was stopping the expansion of its US$30 billion dollar copper/uranium/ gold expansion project at Olympic Dam in South Australia.
In all BHP is slashing $US50 billion in expansion projects, including not only Olympic Dam, but also the Port Hedland harbour expansion planned for Western Australia. According to BHP management, the decision was made due to escalating capital expenditures and operating costs, coupled with the fall of commodity prices.
Despite these numbers, not a single analyst downgraded BHP, with only Deutsche Bank, JP Morgan, and RBS Australia scaling back target prices.
Rio Tinto (RIO) reported half year earnings on 08 August and it is still the analyst favourite. All seven of Australia’s leading analyst firms have RIO as a BUY, OUTPERFORM, or OVERWEIGHT. However, Rio shareholders have not been spared the pain, with the share price dropping almost 25%. Here is a one year price chart:
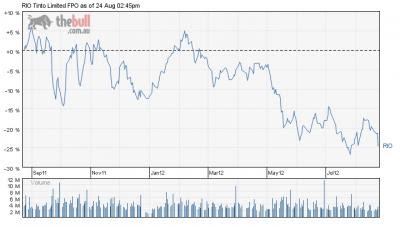
RIO is well diversified with assets in aluminium, coal, copper, diamonds, gold, iron ore, industrial minerals and uranium. Globally, they rank #3 behind BHP and Brazil’s Vale. Like their Australian rival BHP, Rio’s half year earnings results beat lowered analyst expectations but on a year over year basis were pretty grim. Here are some of the lowlights from Rio’s earnings release:
Underlying Earnings dropped 34%, from US$7.8 billion in FY 2011 to US$5.2 billion in 2012.
NPAT fell 22% from US$7.6 billion in 2011 to US$5.9 billion in 2012.
Net Operating Cash Flow declined 39% from US$12.9 billion in FY 2011 to $US7.8 billion in FY 2012.
Unlike BHP, Rio has no immediate plans to stop work on its $US16 billion planned expenditures on expanding production capability. Company management acknowledges challenging conditions in Europe and a slow recovery in the US, but they maintain their belief economic conditions in China will improve by the end of the year.
At the end of the day, iron ore prices will govern investor sentiment - so keep watch on this space. As the price of iron ore tumbled below US$100 a tonne, BHP’s share price fell 1.14% to $33.04, Rio’s dropped 4.28% to $51.86, and pure iron ore plays suffered even more - Fortescue dropping 5.9% to close at $3.99 and Atlas Iron falling 6.76% to $1.65.
Gold, silver and crude oil prices are closely related to the movement of the U.S. dollar.
Gold, silver and crude oil prices are closely related to the movement of the U.S. dollar. After a healthy consolidation, gold began to move up in August 2012. At the same time, deteriorating expectations for crop yields in the American Midwest moved corn and soybean prices to new highs. Higher food prices in late 2012 or early 2013 could have far reaching and geopolitically destabilising effects likely to weigh on stocks, putting the shine back on precious metals. While billionaires George Soros and John Paulson are buying gold, silver has been in backwardation in recent weeks and silver held in ETFs rose to $16.2 billion according to Bloomberg.

While increasing risk of geopolitical instability, including fear of a U.S. or Israeli war with Iran, account for rising crude oil prices and renewed interest in precious metals, the proverbial elephant in the room remains the U.S. dollar vis-à-vis a crumbling Euro. Precious metals mining stocks hit a low in mid May when the U.S. Dollar Index (USDX) shot up +5.5% (4.33 points) from 78.71 on April 27 to 83.04 on May 31. By July 24 the USDX had made a 2-year high of 84.10 as Spanish bond yields soared against a backdrop of continued worries over the European debt crisis. The U.S. dollar then slid -2.25% (1.89 points) to 82.21 on August 2, bouncing back to 82.60 by August 17 with a flat 50-day moving average as precious metals prices and mining stocks rose.

Gold mining stocks, in particular, have suffered due to higher costs related to higher energy prices and lower ore grades, which have compressed cash margins and pushed out returns on capital investments. Gold demand, however, has not abated and higher production costs effectively put a floor under the price of gold.

The key international measure of the U.S. dollar’s value is the price of crude oil. Recessions, depressions and economic slowdowns in the U.S., U.K., Europe, China and Japan have softened demand for crude oil, moderating crude oil prices and making the U.S. dollar stronger than it would have been otherwise.

Weaker fuel consumption in the U.S. has been offset by steady global demand and fears of war in the Middle East which could disrupt oil shipments through the Strait of Hormuz in the Persian Gulf.
Although crude oil prices could moderate in the near term if tensions in the Middle East are resolved, it is more likely that the region will become more chaotic due to higher food prices in late 2012 or early 2013. Further, it is far more likely that conflict between the U.S. or Israel and Iran will escalate. In the long term, oil prices will rise due to growing global demand and higher production costs, i.e., for heavy sour crude, shale oil, etc.
Weak U.S. Dollar Fundamentals
The U.S. dollar is fundamentally weaker than it appears to be based on the USDX. Economic growth in the U.S. is extremely weak, despite massive government deficit spending. U.S. federal government debt of roughly $16 trillion, chronic budget deficits of more than $1 trillion per year and unfunded liabilities of more than $62.3 trillion are unsustainable compared to the U.S. Gross Domestic Product (GDP) of $15.29 trillion (2011 est.), which includes government deficit spending. On a Generally Accepted Accounting Principles (GAAP) basis, which accounts for unfunded liabilities, the U.S. federal deficit would be approximately $5 trillion. The U.S. debt to GDP ratio is approximately 100%, which is worse than that of Spain. Further, the U.S. remains embroiled in foreign wars and continues to prosecute a global “War on Terror” at a total combined cost of several trillion dollars to date.
The Federal Reserve has purchased a large portion of U.S. Treasury bonds since 2008, making the demand for U.S. debt appear stronger than it would have otherwise and artificially suppressing treasury bond yields. The Federal Reserve’s asset purchases (buying toxic mortgage backed securities, quantitative easing I and II and “operation twist”, etc.) represent “money printing”. Money printing weakens the currency and causes prices to rise, which punishes savers, workers and consumers in general. The U.S. Bureau of Labor Statistics’ Consumer Price Index (CPI) has shown little change but pre-1980 measures of inflation are as high as 9%

U.S. domestic price inflation is evident to consumers in terms of food and energy prices, if not in the CPI. The rising cost of living in the U.S. must be contrasted with declining real income and high unemployment. Unemployment in the U.S. indicates a long-term, structural decline in the U.S. job market. Specifically, the civilian population employment ratio has declined for more than a decade.

By all rights, the U.S. dollar should be far weaker, but, to quote Sir Winston Churchill, “the dollar is the worst currency, except for all the alternatives.” The USDX is a weighted geometric mean of the U.S. dollar’s value compared with the euro (57.6% weight), the Japanese yen (13.6% weight), the British Pound sterling (11.9% weight), the Canadian dollar (9.1% weight), the Swedish krona (4.2% weight) and the Swiss franc (3.6% weight).
Euro (EUR) – The saga of European sovereign debt, the threat of default, austerity versus economic growth, rating cuts, last minute rescues and civil unrest continues unabated. The Euro is, in fact, extremely weak which makes the U.S. dollar appear unnaturally strong. The European Central Bank (ECB) has little choice but to create more Euros to bail out the system.
Yen (JPY) – Japan’s recession after a tragic series of economic shocks, i.e., the 2011 tsunami and Fukushima nuclear disaster resulted in an inflow of yen back into Japan, increasing demand in the foreign exchange market. The strengthening yen necessitated massive interventions by central banks to weaken the currency in order to stabilise trade.
Pound sterling (GBP) – The U.K. is mired in a deep recession and the Bank of England is engaged in a series of monetary injections that have weakened the pound. There is no visible light at the end of the tunnel.
Canadian dollar (CAD) – Because Canada’s economy is intertwined with that of the U.S., the Canadian dollar has remained more or less at parity with the U.S. dollar, although it has historically been the weaker of the two.
Krona (SEK) – Sweden’s economy depends on exports and her largest trading partners are in the European Monetary Union, e.g., Germany, Finland, France, Netherlands and Belgium. If the krona appreciates, Swedish exports will fall.
Swiss franc (CHF) – The Swiss National Bank has pegged the Swiss franc to the Euro depriving investors of a traditional safe haven.
The Most Favored Nation
China is struggling to maintain its exports and GDP growth in the face of economic deceleration while battling inflation and the fallout of regional real estate bubbles. The Renminbi (RMB) is closely linked to the U.S. dollar and is managed downward by the People’s Bank of China (PBoC) in order to support Chinese exports.
Due to the relative weakness of other currencies (mainly the EUR, GBP and RMB), the U.S. dollar’s recent strength is illusory. While a weaker U.S. dollar would aid U.S. exports and reduce the U.S trade deficit, high inflation would also punish savers, workers and consumers in general. A solution to the European sovereign debt crisis, a larger and longer term refinancing plan by the ECB, or signs of economic recovery in the Eurozone, would send the U.S. dollar down sharply. Additionally, strong growth in the BRIC countries or an economic recovery in China would greatly increase upward pressure on global commodity prices. Conversely, a continued slowdown in China, which is more likely, will reduce demand for base metals which is bullish for silver because most silver is produced as a byproduct of base metals mining.

Platinum group metals (PGM) could fall as a function of weaker automobile demand if the Chinese economy continues to slow but Chinese automobile sales are up 22.6% year over year. Weaker automotive demand could be offset by safe haven investment demand for platinum and, in the short term, PGM prices are rising sharply due to ongoing mine labor problems in South Africa.

China, together with the other BRIC countries (Brazil, Russia, India and China), South Africa and Iran, is slowly but systematically preparing to move away from the U.S. dollar. At some point, the currently gradual movement of global trade away from the U.S. dollar will reach a critical mass and accelerate. The loss of its world reserve currency status is an existential threat to the U.S. dollar. For the time being, however, it is not in the interest of any of the major players, i.e., China, to dump the U.S. dollar. Despite poor economic conditions in the U.S., U.S. consumers are more addicted than ever to cheap imports from China.

China is a major producer and importer of gold and Chinese companies are aggressively buying crude oil and natural resources around the world but, according to the PBoC, Chinese currency reserves grew 1.9% to $3.24 trillion as of June.

The PBoC and other central banks purchased 400 tonnes of gold in the 12 months ended March 31, 2012 compared with 156 tonnes during the same period in 2011, according to the World Gold Council.
Gold, Silver, Crude Oil
Given the weak fundamentals of the U.S. dollar and the fact that its weakness has been masked by a variety of factors, prices could increase too quickly for policy makers, i.e., Federal Reserve Chairman Ben Bernanke, to respond. The U.S. dollar is vulnerable in the face of potential Eurozone stabilisation, stronger than expected demand from BRIC countries, or geopolitical disintegration linked to higher food prices. Additionally, further intervention by the Federal Reserve could send the U.S. dollar sharply downward and cause a disruptive spike in global commodity prices. Pressure on the Federal Reserve to engage in further monetary easing, e.g., quantitative easing III (QE3), or an equivalent program, is growing. Gold, silver and related mining shares will rally heading into late 2012 and are likely to break out dramatically as current trends develop.
While increasing risk of geopolitical instability, including fear of a U.S. or Israeli war with Iran, account for rising crude oil prices and renewed interest in precious metals, the proverbial elephant in the room remains the U.S. dollar vis-à-vis a crumbling Euro. Precious metals mining stocks hit a low in mid May when the U.S. Dollar Index (USDX) shot up +5.5% (4.33 points) from 78.71 on April 27 to 83.04 on May 31. By July 24 the USDX had made a 2-year high of 84.10 as Spanish bond yields soared against a backdrop of continued worries over the European debt crisis. The U.S. dollar then slid -2.25% (1.89 points) to 82.21 on August 2, bouncing back to 82.60 by August 17 with a flat 50-day moving average as precious metals prices and mining stocks rose.
Gold mining stocks, in particular, have suffered due to higher costs related to higher energy prices and lower ore grades, which have compressed cash margins and pushed out returns on capital investments. Gold demand, however, has not abated and higher production costs effectively put a floor under the price of gold.
The key international measure of the U.S. dollar’s value is the price of crude oil. Recessions, depressions and economic slowdowns in the U.S., U.K., Europe, China and Japan have softened demand for crude oil, moderating crude oil prices and making the U.S. dollar stronger than it would have been otherwise.
Weaker fuel consumption in the U.S. has been offset by steady global demand and fears of war in the Middle East which could disrupt oil shipments through the Strait of Hormuz in the Persian Gulf.
Although crude oil prices could moderate in the near term if tensions in the Middle East are resolved, it is more likely that the region will become more chaotic due to higher food prices in late 2012 or early 2013. Further, it is far more likely that conflict between the U.S. or Israel and Iran will escalate. In the long term, oil prices will rise due to growing global demand and higher production costs, i.e., for heavy sour crude, shale oil, etc.
Weak U.S. Dollar Fundamentals
The U.S. dollar is fundamentally weaker than it appears to be based on the USDX. Economic growth in the U.S. is extremely weak, despite massive government deficit spending. U.S. federal government debt of roughly $16 trillion, chronic budget deficits of more than $1 trillion per year and unfunded liabilities of more than $62.3 trillion are unsustainable compared to the U.S. Gross Domestic Product (GDP) of $15.29 trillion (2011 est.), which includes government deficit spending. On a Generally Accepted Accounting Principles (GAAP) basis, which accounts for unfunded liabilities, the U.S. federal deficit would be approximately $5 trillion. The U.S. debt to GDP ratio is approximately 100%, which is worse than that of Spain. Further, the U.S. remains embroiled in foreign wars and continues to prosecute a global “War on Terror” at a total combined cost of several trillion dollars to date.
The Federal Reserve has purchased a large portion of U.S. Treasury bonds since 2008, making the demand for U.S. debt appear stronger than it would have otherwise and artificially suppressing treasury bond yields. The Federal Reserve’s asset purchases (buying toxic mortgage backed securities, quantitative easing I and II and “operation twist”, etc.) represent “money printing”. Money printing weakens the currency and causes prices to rise, which punishes savers, workers and consumers in general. The U.S. Bureau of Labor Statistics’ Consumer Price Index (CPI) has shown little change but pre-1980 measures of inflation are as high as 9%
U.S. domestic price inflation is evident to consumers in terms of food and energy prices, if not in the CPI. The rising cost of living in the U.S. must be contrasted with declining real income and high unemployment. Unemployment in the U.S. indicates a long-term, structural decline in the U.S. job market. Specifically, the civilian population employment ratio has declined for more than a decade.
By all rights, the U.S. dollar should be far weaker, but, to quote Sir Winston Churchill, “the dollar is the worst currency, except for all the alternatives.” The USDX is a weighted geometric mean of the U.S. dollar’s value compared with the euro (57.6% weight), the Japanese yen (13.6% weight), the British Pound sterling (11.9% weight), the Canadian dollar (9.1% weight), the Swedish krona (4.2% weight) and the Swiss franc (3.6% weight).
Euro (EUR) – The saga of European sovereign debt, the threat of default, austerity versus economic growth, rating cuts, last minute rescues and civil unrest continues unabated. The Euro is, in fact, extremely weak which makes the U.S. dollar appear unnaturally strong. The European Central Bank (ECB) has little choice but to create more Euros to bail out the system.
Yen (JPY) – Japan’s recession after a tragic series of economic shocks, i.e., the 2011 tsunami and Fukushima nuclear disaster resulted in an inflow of yen back into Japan, increasing demand in the foreign exchange market. The strengthening yen necessitated massive interventions by central banks to weaken the currency in order to stabilise trade.
Pound sterling (GBP) – The U.K. is mired in a deep recession and the Bank of England is engaged in a series of monetary injections that have weakened the pound. There is no visible light at the end of the tunnel.
Canadian dollar (CAD) – Because Canada’s economy is intertwined with that of the U.S., the Canadian dollar has remained more or less at parity with the U.S. dollar, although it has historically been the weaker of the two.
Krona (SEK) – Sweden’s economy depends on exports and her largest trading partners are in the European Monetary Union, e.g., Germany, Finland, France, Netherlands and Belgium. If the krona appreciates, Swedish exports will fall.
Swiss franc (CHF) – The Swiss National Bank has pegged the Swiss franc to the Euro depriving investors of a traditional safe haven.
The Most Favored Nation
China is struggling to maintain its exports and GDP growth in the face of economic deceleration while battling inflation and the fallout of regional real estate bubbles. The Renminbi (RMB) is closely linked to the U.S. dollar and is managed downward by the People’s Bank of China (PBoC) in order to support Chinese exports.
Due to the relative weakness of other currencies (mainly the EUR, GBP and RMB), the U.S. dollar’s recent strength is illusory. While a weaker U.S. dollar would aid U.S. exports and reduce the U.S trade deficit, high inflation would also punish savers, workers and consumers in general. A solution to the European sovereign debt crisis, a larger and longer term refinancing plan by the ECB, or signs of economic recovery in the Eurozone, would send the U.S. dollar down sharply. Additionally, strong growth in the BRIC countries or an economic recovery in China would greatly increase upward pressure on global commodity prices. Conversely, a continued slowdown in China, which is more likely, will reduce demand for base metals which is bullish for silver because most silver is produced as a byproduct of base metals mining.
Platinum group metals (PGM) could fall as a function of weaker automobile demand if the Chinese economy continues to slow but Chinese automobile sales are up 22.6% year over year. Weaker automotive demand could be offset by safe haven investment demand for platinum and, in the short term, PGM prices are rising sharply due to ongoing mine labor problems in South Africa.
China, together with the other BRIC countries (Brazil, Russia, India and China), South Africa and Iran, is slowly but systematically preparing to move away from the U.S. dollar. At some point, the currently gradual movement of global trade away from the U.S. dollar will reach a critical mass and accelerate. The loss of its world reserve currency status is an existential threat to the U.S. dollar. For the time being, however, it is not in the interest of any of the major players, i.e., China, to dump the U.S. dollar. Despite poor economic conditions in the U.S., U.S. consumers are more addicted than ever to cheap imports from China.
China is a major producer and importer of gold and Chinese companies are aggressively buying crude oil and natural resources around the world but, according to the PBoC, Chinese currency reserves grew 1.9% to $3.24 trillion as of June.
The PBoC and other central banks purchased 400 tonnes of gold in the 12 months ended March 31, 2012 compared with 156 tonnes during the same period in 2011, according to the World Gold Council.
Gold, Silver, Crude Oil
Given the weak fundamentals of the U.S. dollar and the fact that its weakness has been masked by a variety of factors, prices could increase too quickly for policy makers, i.e., Federal Reserve Chairman Ben Bernanke, to respond. The U.S. dollar is vulnerable in the face of potential Eurozone stabilisation, stronger than expected demand from BRIC countries, or geopolitical disintegration linked to higher food prices. Additionally, further intervention by the Federal Reserve could send the U.S. dollar sharply downward and cause a disruptive spike in global commodity prices. Pressure on the Federal Reserve to engage in further monetary easing, e.g., quantitative easing III (QE3), or an equivalent program, is growing. Gold, silver and related mining shares will rally heading into late 2012 and are likely to break out dramatically as current trends develop.
Today's oil price

$94.90 per barrel
Daily change of 1.25 ( 1.30% )
Oil Quote Updated Aug-27-12 1:30 PM
Sunday, August 26, 2012
Silver Weekly Technical Outlook
Silver took out 28.445 last week and jumped to as high as 30.79 before forming an temporary top there. Initial bias is neutral this week for some consolidation but retreat should be contained above 28.445 support and bring another rally. Rebound from 26.07 should at least be a correction to fall from 37.58. With 38.2% retracement of 37.58 to 26.105 at 30.488 met, the next target will be 61.8% retracement at 33.19.
In the bigger picture, price actions from 26.15 should merely be a consolidation pattern only. Current development indicates that it's still in progress with rebound from 26.105 as a leg. After all, we'd stay bearish as long as 37.58 resistance holds and expect fall from 49.28 to extend lower eventually.
In the long term picture, the main question remains on whether 49.82 is a medium term or long term top. Current development is favoring the latter case. Though, we'd prefer to see sustained break of 61.8% retracement of 8.4 to 49.82 at 24.22 to confirm. Otherwise, price actions from 49.82 could merely be developing into a sideway pattern.
Weekly Fundamentals - Gold Broke Above Resistance on QE3 Hopes
The commodity sector firmed last week with precious metals the best performer. Heightened hopes of further monetary easing from the Fed sent gold prices higher with important near-term resistance broken. The Fed’s August minutes were dovish, indicating further monetary easing highly likely. As the minutes indicated that many members believed that more monetary easing measures should be implemented soon unless upcoming economic data showed "a substantial and sustainable strengthening" in economic recovery. Further monetary easing has now become a matter of "when", instead a matter of "if". PGMs soared as driven by supply disruption in South Africa. Labor strike in platinum mines operated by Lonmin has tendency to spread to other mines and the supply/demand balance will be affected. However, we expect surplus will remain this year. Rally in crude oil prices paused after gaining over the past few weeks. Sanctions over Iran and maintenance in a North Sea field are raising concerns over supply problems. On the demand side, both OECD and non-OECD demand appeared to grow in the third quarter. These all together led to recent strength in oil prices. The WTI-Brent narrowed last week but remained in the double-digit territory. Debates have been on whether the spread will widen further in coming months. In our opinion, further widening seems unlikely as factors sending Brent crude oil prices higher have priced in while the situation in WTI crude is not as poor as perceived. Yet, we expect the spread will continue hovering around current levels.

Crude Oil: Crude oil paused after rallying over the past 3 weeks. However, the outlook remained firm and big correction appears unlikely in the near-term as strong fundamentals remained in place. Maintenance at the Buzzard field has tightened supply in the North Sea. The situation will only improve when it’s completed in September. The North Sea supply has widened WTI-Brent spread in recently. There have been discussions over whether the situation will exacerbate in the fourth quarter. We think this is not likely. Relief in oil supply after maintenance, seasonally weaker crude demand after mid-October and potential SPR release are expected to ease the tight oil market in coming month.
Concerning WTI crude, overcapacity has been the main reason for sending WTI crude oil price below than of Brent. The situation will alleviate modestly as more storage facilities have been invested over the past 1-2 years in Canada, Cushing and the Midwest The sharp fall in WTI crude oil prices due to the Cushing over-stockpiling should not repeat.

Natural Gas: Nymex natural gas price plunged for a 5th week. According to the DOE/EIA, natural gas storage increased 47 bcf to 3 308 bcf in the week ended August 17. Stocks were +423 bcf higher than the same period last year and +357 bcf above the 5-year average of 2 951 bcf. Separately, Baker Hughes reported that the number of gas rigs gained +2 units to 486 in the week ended August 24. Oil rigs fell -17 units to 1 408 and miscellaneous rigs dipped+1 unit to 4 and the total number of rigs was down -16 units to 1 891 units. Directionally oriented combined oil, gas, and miscellaneous rigs slipped -9 units to 229 units while horizontal rigs increased +6 units to 1 159 and vertical rigs slid -13 units to 519 during the week.


Precious Metals: Gold extended the rally last week after breaking above important resistance at 1640. The dovish FOMC minutes for the August meeting raised speculations of QE3. As the meeting was held before release of the July employment report, we believe the next trigger point would be the August report (due September 7), together with the Beige book and Fed Chairman Ben Bernanke’s Jackson Hole address on August 31. However, while it’s likely that further monetary measures would be announced in September, the tool might not necessary be QE3. Judging from the tone in the minutes, policymakers might choose to change the language guidance at that meeting.
Platinum price has rallied more than $150/oz since August 15 as violence at Lonmin mines has raised concerns over production suspension. The spread between gold and platinum has since narrowed. However, it’s uneasy for platinum to regain its premium over gold like 2011 and before. It is because the production losses in Impala and Aquarius Platinum, Eastern Platinum and Lonmin, while evidenced the risks posed by labor actions in South Africa on production, are likely to remove the surplus (supply> demand) in the platinum market in 2012.

Natural Gas Weekly Technical Outlook
Despite a breach of 2.848 minor resistance, there was no sustained buying in natural gas for rebound last week. Instead it weakened again to close the week near to the low. We'd stay bearish in natural gas for the moment, with focus on the lower channel support (now at 2.695). Break will affirm the rebound from 1.902 has completed at 3.277 and bring deeper fall to 2.168 support and below. However, note that it's staying in near term rising channel so far. Break of 2.877 minor resistance will indicate that pull back from 3.277 is completed and will turn focus back to this resistance level.
In the bigger picture, the failure to sustain above 3.255 support turned resistance didn't confirm medium term trend reversal. That is, whole decline from 6.108 could still extend and a break below 2.168 will pave the way to a new low below 1.902. Nonetheless, again, sustained break of 3.255 will confirm trend reversal and a test on 4.983 key resistance level should at least be seen.
In the longer term picture, as long as 3.255 resistance holds, whole down trend from 13.694 (2008 high) is still in progress, so is that from 15.78 (2005 high). Another fall could be seen to 1999 low of 1.62 on resumption. But decisive break of 3.255 will now be an important sign of long term bottoming,
Crude Oil Weekly Technical Outlook
Crude oil rose to as high as 98.29 last week and met mentioned target of 61.8% retracement of 110.55 to 77.28 at 97.84. A short term top could be formed there on bearish divergence condition in 4 hours MACD. Bias is turned neutral for some consolidations first. Note another rally remains in favor as long as 92.94 support holds. Above 98.29 will turn bias back to the upside for 100 and above. However, rise from 77.28 could be the fourth leg inside the triangle patter from 114.83. Hence, we'll be cautious on topping between 100 and 110. Meanwhile, break of 92.94 will be the first signal of reversal and turn focus to 86.92 support for confirmation.
In the bigger picture, price actions from 114.83 are viewed either a three wave consolidation pattern that's completed at 77.28, or a five wave triangle pattern that's still unfolding. In any case, break of 110.55 resistance will strongly suggest that whole rebound from 33.29 has resumed for above 114.83. While another fall could be seen before an eventual upside breakout, downside should be contained above 77.28 support.
In the long term picture, crude oil is in a long term consolidation pattern from 147.27, with first wave completed at 33.2. The corrective structure of the rise from 33.2 indicates that it's second wave of the consolidation pattern. While it could make another high above 114.83, we'd anticipate strong resistance ahead of 147.24 to bring reversal for the third leg of the consolidation pattern.
Gold Weekly Technical Outlook
Gold break 1642.4 resistance last week and rose to as high as 1677.5 before forming a temporary top there. Initial bias is neutral this week for some consolidations but downside of retreat should be contained well above 1629.7 support and bring another rise. Current development indicates that fall from 1792.7 is completed at 1526.7 already. Further rally is expected ahead for upper trend line resistance (now at 1770). Though, we'd be cautious on topping there.
In the bigger picture, price actions from 1923.7 high are viewed as a medium term consolidation pattern. There is no indication that such consolidation is finished, and more range trading could be seen. In any case, downside of any falling leg should be contained by 1478.3/1577.4 support zone and bring rebound. Meanwhile, break of 1792.7 resistance is needed to be the first signal of up trend resumption. Otherwise, the consolidation would extend further.
In the long term picture, with 1478.3 support intact, there is no change in the long term bullish outlook in gold. While some more medium term consolidation cannot be ruled out, we'd anticipate an eventual break of 2000 psychological level in the long run
Today's oil price

$96.12 per barrel
Daily change of 0.08 ( 0.08% )
Oil Quote Updated Aug-26-12 10:00 AM
Saturday, August 25, 2012
Understanding Gold Exchange Traded Funds ETFs
Historically, investing in gold has been the popular choice of people looking for diversification of holdings. This precious metal, which is traded actively by institutions and individuals, has long been a favorite haven for investors. It is one of the last of the safe options remaining especially after the Swiss Franc was fixed to the Euro.
Gold is doubly attractive because it offers greater chances of long-term price appreciation. Gold prices have proved on countless occasions to be seemingly immune to global turmoil. In fact the price of gold has almost doubled since 2008 despite the global meltdown during those years.
Gold is an excellent portfolio hedge because its price generally moves inverse to prime equity standards, typically offering a healthy return when markets are in a slump.
What are Gold Exchange Traded Funds?
Gold Exchange Traded Funds (ETFs) are funds linked to the price of gold. They are listed and traded on all major stock exchanges in the world, and are backed by gold bullion stored in secure vaults. Gold backed ETFs provide a way for investors to trade in the gold bullion market without the need to take physical possession of the metal. ETFs make gold more accessible to investors and enable them to buy and sell securities on the stock market. The prices of ETFs fluctuate proportionately with the prevailing price of gold and deliver the same returns. Each ETF unit is roughly the price of one gram of gold, though there are ETFs which equate to half a gram.
Why should you invest in Gold ETFs?
Gold ETFs are a good investment because they are:
Highly liquid and can easily be traded
In the Global Asset Class
A hedge against currency fluctuation and inflation
Less volatile than equities hence less risk
Diversification of your portfolio
An asset held in an electronic form
Have no chance of adulteration as in physical gold
Perfect for a retail investor as the minimum trading lot is a single unit
An investment product with a Net Asset Value of a unit equating to a price of 1 or ½ gram of gold
How To Invest?
Gold backed ETFs, which are regulated financial products, are listed on all major stock exchanges. Your broker or financial adviser should be able to assist you in trading.
Best known ETFs in the Stock Market
SPDR Gold Trust (GLD): This is the largest of the gold backed ETFs globally, and an investor favorite. Daily trading volumes average several billions. This is the ideal fund for both ‘buy and hold’ investors and traders. Each share is equivalent approximately to the value of 1/10th of a troy ounce of gold.
COMEX Gold Trust (IAU): This trust is a leading competitor to GLD. It offers access to bullion at only 25 basis points, a super-low cost. Each share approximates the value of 1/100th of a gold troy ounce.
Physical Swiss Gold Shares (SGOL): Funds backed by bullion held physically in vaults situated exclusively in Switzerland. Ideal for investors who prefer to keep investments outside the U.K and U.S.
Physical Asian Gold Shares (AGOL): As with SGOL, this exchange traded fund is backed by bullion held in vaults in Singapore in Southeast Asia.
Subscribe to:
Comments (Atom)