Commodities - oil - Metals - Gold - Real Estate - money - stocks - the economy - and trade - investment
Monday, August 27, 2012
Should iron ore prices continue to fall, further project cancellations will see higher unemployment.
Based on the number of media reports this week, you'd think that the sky was falling. Although the sky isn't falling, iron ore prices are - and they're triggering a slew of possible events from a fallout in the Aussie dollar to a hole in our terms of trade.
According to a report in the AFR, steel production in China dropped 10% in the opening weeks of August. Product is gathering dust in the face of a weak construction market.
In November last year, US investment bank Goldman Sachs cut its yearly forecast for the price of iron ore by 6%, down to US$167.40 a tonne. They also forecasted an additional 16% drop in 2012, down to US$147.50 a tonne. According to Goldman, by 2012 the price of iron ore would average $US105 a tonne.
In March this year, the Australian Bureau of Resources and Energy Economics (BREE) said iron ore prices would average approximately US$140 a tonne in 2012 and by June had reduced the forecasted price to US$136.
You know where this story is going. None of the above predictions foresaw the price of iron ore dropping below US$100 a tonne, but it did. Just this week, on 23 August 2012, iron ore for immediate delivery fell for the seventh day, dropping 4.9% to US$99.60 a tonne. The chart below tracks the commodities fairly recent slide:
From London, Deutsche Bank analysts are telling speculators to go long iron ore below $US90 a tonne. They foresee panic selling pushing the price to US$90 a tonne - but bottoming soon after. Chinese inventory adjustment could explain the sudden shortfall in demand as the Chinese stockpile inventory - from raw materials to finished goods.
Deutsche Bank argues that the gradual winding down of economic growth in China has made government slow to react with policy measures, unlike the response to the rapid declines in 2008 and the equally rapid stimulus response.
In short, there has been minimal reaction by the Chinese to boost domestic demand - although there has been plenty of talk.
Lower iron ore prices affect our terms or trade - so much so that recent price declines could trigger a $10 million budget shortfall. When the budget was finalised, tax revenue estimates were based on iron ore prices at US$150 a tonne, with the possibility that prices could fall as low as US$120 a tonne. No one foresaw the commodity breaching US$100 a tonne (a level that makes China’s own domestic iron ore industry unprofitable).
Why should we care about our terms of trade? Well, according to Deutsche's economist, Adam Boyton, our terms of trade (or the difference between what the country is paid for exports and what it pays for imports) could decline by 15% through 2012. The warning bells are ringing - if the Government doesn't act fast, Australia could find itself mired in recession. Deutsche believes that the government is overly complacent due to the A$500 billion in resource investment projects already in place.
But resource projects are getting wound back. This week BHP announced that it was scrapping its $A28.73 billion Olympic Dam open pit expansion due to lower commodity prices and higher capital costs. As many as 140 staff will lose their jobs.
Should iron ore prices continue to fall, further project cancellations will see higher unemployment. Early this week the Australian Securities and Investment Commission (ASIC) reported business insolvencies reached record levels through 30 June 2012, with the highest filings in mining states.
In the midst of all this, our third largest iron ore producer Fortescue Metals (FMG) stepped up and delivered a solid earnings report this week, following a tough year for shareholders:
To put their year over year performance in perspective, the average realised price of iron ore over FY 2012 was US$120.2, down 12% from FY 2011’s average realised price of US$136.8.
Yet FMG beat consensus analyst estimates on both revenues and earnings. Here are some highlights from Fortescue’s full year earnings release:
Tonnes shipped (in millions) increased 42% from 39.4 tonnes in FY 2011 to 55.8 tonnes in FY2012.
Revenue was up 23% from US$5.4 billion in 2011 to US$6.7 billion in FY 2012.
Net Profit after Tax (NPAT) increased 53% from US$1.01 billion in FY 2011 to US$1.56 billion in 2012.
Net operating cash flow increased from US$2.77 on 2011 to US$2.80 in 2012.
Earnings per Share (EPS) went up 52% from US$0.329 in FY 2011 to US$0.501 in 2012.
Despite a 25% drop in iron ore prices since the end of Fortescue’s Fiscal Year and sluggish Chinese demand, the company is steaming ahead with plans to invest US$9 billion to triple its production capacity by mid 2013.
Fortescue management foresee iron ore prices rising to US$120 in the “medium term.” If iron ore prices remain stubbornly low, however, the company could be in some trouble. Currently, Fortescue is sitting on US$6 billion in debt and gearing of 226%.
Management hopes to reduce gearing to around 40% by 2014 investors; any additional funding will be accessed by a revolving credit facility.
As a pure iron ore play, Fortescue is vulnerable to further falls in the price of iron ore; interest payments on its massive debt must be met regardless of what happens to China. However, Fortescue steadfastly maintains demand will pick up in China later in the year.
What some investors forget is that China's domestic iron ore industry produces a lower grade of ore which supplies around 30% of the country’s demand. China’s domestic iron ore contains only about 20 percent iron while Australian imported ore contains more than 55% iron.
One argument is that lower iron ore prices can make imported iron ore cheaper than domestic supply. Can China's domestic iron ore industry survive when a superior grade of ore can be imported at a lower cost?
Iron ore production in China is indeed falling and there's already evidence Chinese Steel manufacturers are beginning to look to imported iron ore from Australia and Brazil. If the Chinese replace their own domestic ore with imported ore, prices could bounce.
China’s Premier Wen Jiabao is also spearheading US$23 billion of investment in new steel mills to boost production in auto-making, energy efficient appliances, and housing to jolt China’s slowing economy.
If the price remains below US$100 and declines further, the share prices of our major iron ore miners will take a thrashing; junior miners will fare even worse.
Pure iron ore plays such as Fortescue Metals and Atlas Iron (AGO) are more vulnerable than the diversified giants like Rio Tinto (RIO) and especially BHP Billiton (BHP).
While many Australians think of BHP as just a miner, the company has the most diversified resources asset base in the world. BHP is an oil and gas explorer and producer, and a miner of alumina, coal, copper, diamonds, uranium, gold, and of course iron ore. BHP shares are down almost 15% year over year. Here is a one year price chart for BHP:
Regardless of the benefits of diversification, the prices of copper, coal, and alumina have suffered alongside iron ore - limiting BHP's profits.
In addition, BHP incurred one-off write downs in its US operations. Here are some of the lowlights from the earnings release:
Revenue increased 0.7% to US$72.2 billion.
Operating profit dropped 25.3% to 23.7 billion.
NPAT fell 34% to S15.4 billion, but beat analyst estimates of US$14.6 billion.
Net Operating Cash Flow declined 18.9% to US$24.4 billion.
EPS fell 32.5% to US$0.29.
The health of the mining boom has been under the microscope for over a year and BHP’s ambitious expansion plans were often cited as evidence that all is well.
Just this week, Resources and Energy Minister Martin Ferguson joined the growing chorus declaring the end of the mining boom. His comments came after BHP announced it was stopping the expansion of its US$30 billion dollar copper/uranium/ gold expansion project at Olympic Dam in South Australia.
In all BHP is slashing $US50 billion in expansion projects, including not only Olympic Dam, but also the Port Hedland harbour expansion planned for Western Australia. According to BHP management, the decision was made due to escalating capital expenditures and operating costs, coupled with the fall of commodity prices.
Despite these numbers, not a single analyst downgraded BHP, with only Deutsche Bank, JP Morgan, and RBS Australia scaling back target prices.
Rio Tinto (RIO) reported half year earnings on 08 August and it is still the analyst favourite. All seven of Australia’s leading analyst firms have RIO as a BUY, OUTPERFORM, or OVERWEIGHT. However, Rio shareholders have not been spared the pain, with the share price dropping almost 25%. Here is a one year price chart:
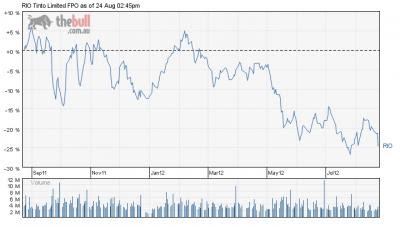
RIO is well diversified with assets in aluminium, coal, copper, diamonds, gold, iron ore, industrial minerals and uranium. Globally, they rank #3 behind BHP and Brazil’s Vale. Like their Australian rival BHP, Rio’s half year earnings results beat lowered analyst expectations but on a year over year basis were pretty grim. Here are some of the lowlights from Rio’s earnings release:
Underlying Earnings dropped 34%, from US$7.8 billion in FY 2011 to US$5.2 billion in 2012.
NPAT fell 22% from US$7.6 billion in 2011 to US$5.9 billion in 2012.
Net Operating Cash Flow declined 39% from US$12.9 billion in FY 2011 to $US7.8 billion in FY 2012.
Unlike BHP, Rio has no immediate plans to stop work on its $US16 billion planned expenditures on expanding production capability. Company management acknowledges challenging conditions in Europe and a slow recovery in the US, but they maintain their belief economic conditions in China will improve by the end of the year.
At the end of the day, iron ore prices will govern investor sentiment - so keep watch on this space. As the price of iron ore tumbled below US$100 a tonne, BHP’s share price fell 1.14% to $33.04, Rio’s dropped 4.28% to $51.86, and pure iron ore plays suffered even more - Fortescue dropping 5.9% to close at $3.99 and Atlas Iron falling 6.76% to $1.65.
Gold, silver and crude oil prices are closely related to the movement of the U.S. dollar.
Gold, silver and crude oil prices are closely related to the movement of the U.S. dollar. After a healthy consolidation, gold began to move up in August 2012. At the same time, deteriorating expectations for crop yields in the American Midwest moved corn and soybean prices to new highs. Higher food prices in late 2012 or early 2013 could have far reaching and geopolitically destabilising effects likely to weigh on stocks, putting the shine back on precious metals. While billionaires George Soros and John Paulson are buying gold, silver has been in backwardation in recent weeks and silver held in ETFs rose to $16.2 billion according to Bloomberg.
While increasing risk of geopolitical instability, including fear of a U.S. or Israeli war with Iran, account for rising crude oil prices and renewed interest in precious metals, the proverbial elephant in the room remains the U.S. dollar vis-à-vis a crumbling Euro. Precious metals mining stocks hit a low in mid May when the U.S. Dollar Index (USDX) shot up +5.5% (4.33 points) from 78.71 on April 27 to 83.04 on May 31. By July 24 the USDX had made a 2-year high of 84.10 as Spanish bond yields soared against a backdrop of continued worries over the European debt crisis. The U.S. dollar then slid -2.25% (1.89 points) to 82.21 on August 2, bouncing back to 82.60 by August 17 with a flat 50-day moving average as precious metals prices and mining stocks rose.
Gold mining stocks, in particular, have suffered due to higher costs related to higher energy prices and lower ore grades, which have compressed cash margins and pushed out returns on capital investments. Gold demand, however, has not abated and higher production costs effectively put a floor under the price of gold.
The key international measure of the U.S. dollar’s value is the price of crude oil. Recessions, depressions and economic slowdowns in the U.S., U.K., Europe, China and Japan have softened demand for crude oil, moderating crude oil prices and making the U.S. dollar stronger than it would have been otherwise.
Weaker fuel consumption in the U.S. has been offset by steady global demand and fears of war in the Middle East which could disrupt oil shipments through the Strait of Hormuz in the Persian Gulf.
Although crude oil prices could moderate in the near term if tensions in the Middle East are resolved, it is more likely that the region will become more chaotic due to higher food prices in late 2012 or early 2013. Further, it is far more likely that conflict between the U.S. or Israel and Iran will escalate. In the long term, oil prices will rise due to growing global demand and higher production costs, i.e., for heavy sour crude, shale oil, etc.
Weak U.S. Dollar Fundamentals
The U.S. dollar is fundamentally weaker than it appears to be based on the USDX. Economic growth in the U.S. is extremely weak, despite massive government deficit spending. U.S. federal government debt of roughly $16 trillion, chronic budget deficits of more than $1 trillion per year and unfunded liabilities of more than $62.3 trillion are unsustainable compared to the U.S. Gross Domestic Product (GDP) of $15.29 trillion (2011 est.), which includes government deficit spending. On a Generally Accepted Accounting Principles (GAAP) basis, which accounts for unfunded liabilities, the U.S. federal deficit would be approximately $5 trillion. The U.S. debt to GDP ratio is approximately 100%, which is worse than that of Spain. Further, the U.S. remains embroiled in foreign wars and continues to prosecute a global “War on Terror” at a total combined cost of several trillion dollars to date.
The Federal Reserve has purchased a large portion of U.S. Treasury bonds since 2008, making the demand for U.S. debt appear stronger than it would have otherwise and artificially suppressing treasury bond yields. The Federal Reserve’s asset purchases (buying toxic mortgage backed securities, quantitative easing I and II and “operation twist”, etc.) represent “money printing”. Money printing weakens the currency and causes prices to rise, which punishes savers, workers and consumers in general. The U.S. Bureau of Labor Statistics’ Consumer Price Index (CPI) has shown little change but pre-1980 measures of inflation are as high as 9%
U.S. domestic price inflation is evident to consumers in terms of food and energy prices, if not in the CPI. The rising cost of living in the U.S. must be contrasted with declining real income and high unemployment. Unemployment in the U.S. indicates a long-term, structural decline in the U.S. job market. Specifically, the civilian population employment ratio has declined for more than a decade.
By all rights, the U.S. dollar should be far weaker, but, to quote Sir Winston Churchill, “the dollar is the worst currency, except for all the alternatives.” The USDX is a weighted geometric mean of the U.S. dollar’s value compared with the euro (57.6% weight), the Japanese yen (13.6% weight), the British Pound sterling (11.9% weight), the Canadian dollar (9.1% weight), the Swedish krona (4.2% weight) and the Swiss franc (3.6% weight).
Euro (EUR) – The saga of European sovereign debt, the threat of default, austerity versus economic growth, rating cuts, last minute rescues and civil unrest continues unabated. The Euro is, in fact, extremely weak which makes the U.S. dollar appear unnaturally strong. The European Central Bank (ECB) has little choice but to create more Euros to bail out the system.
Yen (JPY) – Japan’s recession after a tragic series of economic shocks, i.e., the 2011 tsunami and Fukushima nuclear disaster resulted in an inflow of yen back into Japan, increasing demand in the foreign exchange market. The strengthening yen necessitated massive interventions by central banks to weaken the currency in order to stabilise trade.
Pound sterling (GBP) – The U.K. is mired in a deep recession and the Bank of England is engaged in a series of monetary injections that have weakened the pound. There is no visible light at the end of the tunnel.
Canadian dollar (CAD) – Because Canada’s economy is intertwined with that of the U.S., the Canadian dollar has remained more or less at parity with the U.S. dollar, although it has historically been the weaker of the two.
Krona (SEK) – Sweden’s economy depends on exports and her largest trading partners are in the European Monetary Union, e.g., Germany, Finland, France, Netherlands and Belgium. If the krona appreciates, Swedish exports will fall.
Swiss franc (CHF) – The Swiss National Bank has pegged the Swiss franc to the Euro depriving investors of a traditional safe haven.
The Most Favored Nation
China is struggling to maintain its exports and GDP growth in the face of economic deceleration while battling inflation and the fallout of regional real estate bubbles. The Renminbi (RMB) is closely linked to the U.S. dollar and is managed downward by the People’s Bank of China (PBoC) in order to support Chinese exports.
Due to the relative weakness of other currencies (mainly the EUR, GBP and RMB), the U.S. dollar’s recent strength is illusory. While a weaker U.S. dollar would aid U.S. exports and reduce the U.S trade deficit, high inflation would also punish savers, workers and consumers in general. A solution to the European sovereign debt crisis, a larger and longer term refinancing plan by the ECB, or signs of economic recovery in the Eurozone, would send the U.S. dollar down sharply. Additionally, strong growth in the BRIC countries or an economic recovery in China would greatly increase upward pressure on global commodity prices. Conversely, a continued slowdown in China, which is more likely, will reduce demand for base metals which is bullish for silver because most silver is produced as a byproduct of base metals mining.
Platinum group metals (PGM) could fall as a function of weaker automobile demand if the Chinese economy continues to slow but Chinese automobile sales are up 22.6% year over year. Weaker automotive demand could be offset by safe haven investment demand for platinum and, in the short term, PGM prices are rising sharply due to ongoing mine labor problems in South Africa.
China, together with the other BRIC countries (Brazil, Russia, India and China), South Africa and Iran, is slowly but systematically preparing to move away from the U.S. dollar. At some point, the currently gradual movement of global trade away from the U.S. dollar will reach a critical mass and accelerate. The loss of its world reserve currency status is an existential threat to the U.S. dollar. For the time being, however, it is not in the interest of any of the major players, i.e., China, to dump the U.S. dollar. Despite poor economic conditions in the U.S., U.S. consumers are more addicted than ever to cheap imports from China.
China is a major producer and importer of gold and Chinese companies are aggressively buying crude oil and natural resources around the world but, according to the PBoC, Chinese currency reserves grew 1.9% to $3.24 trillion as of June.
The PBoC and other central banks purchased 400 tonnes of gold in the 12 months ended March 31, 2012 compared with 156 tonnes during the same period in 2011, according to the World Gold Council.
Gold, Silver, Crude Oil
Given the weak fundamentals of the U.S. dollar and the fact that its weakness has been masked by a variety of factors, prices could increase too quickly for policy makers, i.e., Federal Reserve Chairman Ben Bernanke, to respond. The U.S. dollar is vulnerable in the face of potential Eurozone stabilisation, stronger than expected demand from BRIC countries, or geopolitical disintegration linked to higher food prices. Additionally, further intervention by the Federal Reserve could send the U.S. dollar sharply downward and cause a disruptive spike in global commodity prices. Pressure on the Federal Reserve to engage in further monetary easing, e.g., quantitative easing III (QE3), or an equivalent program, is growing. Gold, silver and related mining shares will rally heading into late 2012 and are likely to break out dramatically as current trends develop.
Subscribe to:
Posts (Atom)